12 Key Mobile App KPIs To Measure That Will Improve Your Customer Engagement
The best way to learn how your mobile app performs is by measuring your key performance indicators. This article will provide insight into the key mobile app KPIs to track to improve your customer engagement.

If you've looked at your mobile app's analytics data, it can be overwhelming to know what's actually important and what to focus on. Which metrics are the most important for business growth? Which metric will show you revenue performance? Finding the right answers to these questions is crucial for the success of your business.
This way, you can stay on top of data. Even more, it will help you know how long customers use your app, the features you need to abandon, where you need to improve your marketing efforts, and more. Using the right analytics software can help you dig into analytics data and learn how to improve customer engagement.
In this article, we'll explain the 12 Key KPIs to track in mobile marketing and how to use the insight to improve customer engagement.
Let's begin with a brief overview of mobile app KPIs.
Table of contents
- Mobile App KPIs: An Overview
- The Most Important Mobile App KPIs
- UX and performance metrics
- User Engagement KPIs
- Revenue KPIs
- Conclusion
Mobile App KPIs: an overview
Your mobile app's performance depends on analytics and key performance indicators.
This means that you need to choose a suitable mobile analytics software that will provide insight into analytics data.
When you regularly monitor key KPIs for your mobile app, you can learn more about the valuation of your app and improve the performance of your product.
You must include monitoring KPIs in your marketing strategies and development process.
In the next section, we'll explain the most important metrics to track in mobile marketing.
The Most Important Mobile App KPIs
In mobile marketing, the most important mobile app KPIs to track is based on the specific stage of the user journey you're evaluating.
We have divided app performance metrics can be divided into three:
- UX and performance mobile app KPIs
- User engagement KPIs
- Revenue KPIs
Let's explain each of these metrics in detail.
1. UX and Performance Metrics
UX and performance metrics provide insight into your app's technical performance. With these metrics, you can identify performance issues like slow loading, bugs, or issues with your app's interface.
Here are some important metrics to track to learn about your app's performance:
- Load speed
- Crashes
- Devices and OS
- Screen resolution
Load speed: Load speed indicates the amount of time it takes before a user begins to interact with your app. Most people don't like to wait long before they begin to use an app. If your app's load speed is slow, it can damage the user experience and users won't hesitate to uninstall your app.
So it's good practice to measure your app's loading speed and figure out if it's impacting your business growth.
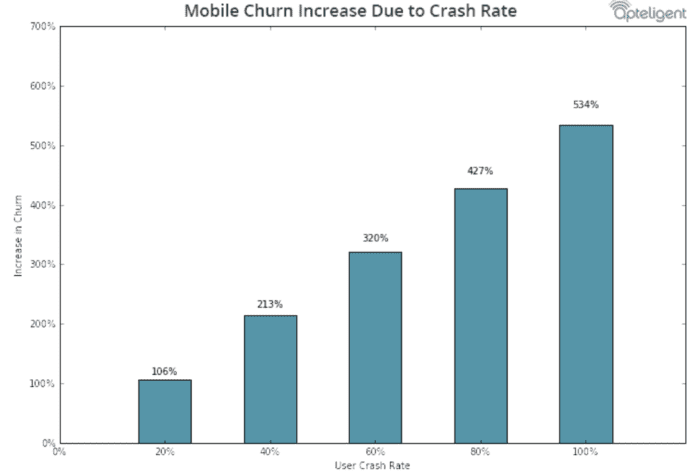
Crashes: While different operating systems function by different rules, it's still common for an app to crash from time to time. There are various reasons why this can happen such as the complexity of the product, unexpected user actions, and more.
Failure to track any app crash can greatly increase your churn rate.
With crash reports, you can learn the cause of a crash, the exact moment it occurred, and the specific part of your mobile app that needs to be fixed.
This way, you don't need to spend too much time troubleshooting app bugs.
Devices and OS: The type of device your users use to access your app is another app metric you need to track. What percentage of users are using tablets, desktops, smartphones, Android, or iOs? When you get this data, you can use it to optimize your app's performance accordingly. For example, if there's a high crash or uninstall rate for iOS users, you can learn why it is happening and solve any issues.
Screen resolution: Just like devices and operating systems, this metric helps you to learn what you need to test. For instance, you can figure out the different t resolutions for Android users. Android phones usually have a wide variety of resolutions which can make it harder to provide a great user experience. When you know the different resolutions of your users, you can optimize your app for an improved customer experience.
2. User Engagement KPIs
This metric focuses on the various performance indicators that highlight how your customers engage and interact with your mobile app. When you analyze them, you can learn what users like or don't like about your app.
Here are some important metrics to track:
- Active users
- Retention rate
- Funnel conversion rate
- Session length
Active users: It's one thing to get user downloads and another to get customers to use your app. If customers are downloading your app but not using it then there's a problem.
Studies have shown that apps lose an average of 75% of users starting from the first day of app installation.
This shows that user engagement is a major aspect of mobile marketing, so, it's important to track your daily, weekly, and monthly active users.
It's best that the number of active users that engage with your app increases each month. If you notice that the number is low, you need to implement some marketing strategies like push notifications and in-app messages.
Retention rate: Retention rate is one of the most important mobile app KPIs to track. This metric shows the number of users that return to your mobile app after their initial usage. This KPI for mobile apps shows whether your customers are getting value from your app.
You can calculate the retention rate with this formula:
Aggregated retention rate = number of monthly users/number of app installs
Funnel conversion rate: This metric shows you how users move at every stage of the marketing funnel. For instance, you can track where users drop off, figure out the reason for the drop-off and make improvements to optimize the customer lifecycle funnel.
Session length: Session length tells how long users spend on your app. The session length is counted right from the time a user opens an app to the time it is closed. It's important to track this metric because it helps you to understand if a customer is spending enough time on your app to reach your business conversion goals.
For instance, in e-commerce companies, conversion goals can include various actions like completing a checkout process, downloading a freebie, or sharing content.
3. Revenue KPIs
Like every other form of marketing, tracking revenue is a must-do. When it comes to measuring revenue, you need to track the profit derived from your app, and the money used to acquire new users and buyers.
Here are the most important metrics we'll explain:
- Mobile conversion rate
- Lifetime value
- Cost of customer acquisition
- The average revenue per user
Mobile conversion rate: The conversion rate shows you the amount of revenue that is derived from customer purchases or subscriptions.
The best way to track conversion rates is by setting up events in your mobile analytics. Events are customer actions that occur in your app. You can set up events for:
- customers that successfully completed a payment subscription
- Customers that encountered an error on the checkout page
- Customers that dropped off the funnel
Customer Lifetime Value: This metric shows you the amount of money that each customer has brought to your business since they started using your app. This way, you can learn the level of loyalty and commitment customers give your brand.
Cost of customer acquisition: This metric focuses on defining the costs associated with the acquisition of a paying customer. It can also be related to other costs besides the paid user acquisition.
The average revenue per user: By tracking this metric you can learn how much users spend on your app. You can learn the user's that make additional sales and how solvent your customer base is. Though you should note that users often spend different amounts of time, and make different purchases, hence the amount they spend will differ.
Conclusion
There is a wide variety of KPIs to track for your mobile app. When it comes to tracking mobile app performance metrics, you need to start from the most important ones.
In summary, the most important metrics to track fall into three categories:
- UX and performance metrics
- User engagement
- Revenue KPIs
Focus on these KPIs for your mobile app and learn how they impact your marketing funnel.
This way, you can learn how customers engage with your app, identify bugs impacting performance, improve your mobile marketing strategy and make your app more successful.
At Engage, we have made this process less challenging for you. With our powerful automation software, you can dig deeper into mobile analytics and uncover key details about how customers use your app.
Get started for free.